


Erratic Equities and Gyrating Gilts...
CPI kicks off a bout of volatility, equities leave market participants exasperated, and monetary policy makers may finally be forcing the hand of fiscal policy makers...

Welcome back to Market Making, your weekly dose of sell-side research and insight.
⏱️ Estimated Read Time: ~38min
✍️ Word Count: ~8,158
📚 This week’s Reading List has been updated
Part 1: CPI Print Proves a Point
Thursday ushered in a significantly higher CPI print than markets anticipated. As one desk note from JPM described it just minutes after its release, “… it’s hard to imagine how anyone could try to craft a positive narrative coming out of this print.”
But if you were enjoying a nice vacation - far away from your terminal - you’d be forgiven if you checked in on markets end of day and thought that the print came well below expectations and that the ever-elusive Fed pivot was truly, finally, here.

We’ll get into what’s been going on in equities over the past few days in the next part of the newsletter (hint: when markets are volatile and illiquid, the easiest explanations always end up being more technical than fundamental — to whet your appetite: Goldman reported a near all-time record for ETF activity for a reason).
But first, back to CPI. Let’s quickly go over the headline numbers here:
CPI (MoM) +0.39% for September, median forecast +0.2%, prior +0.12%
Core CPI (MoM) +0.58% for September, median forecast +0.4%, prior +0.57%
CPI (YoY) +8.20% for September, median forecast +8.1%, prior +8.26%
Core CPI (YoY) +6.63% for September, median forecast +6.5%, prior +6.32%
When it comes to bank analyst expectations, no one was particularly close. Most were crowded around the 0.4% MoM mark for Core CPI, so getting a print of 0.6% undoubtably caused some grumbling among analysts Thursday morning.

However, the CPI print does prove a few points that I’ve brought up in weeks past, so let’s revisit those and talk about a few things of note within this print.
First, Did This Print Ever Even Matter…?
Not all economic data is created equal, and sometimes its worth looking through the data even if it surprises to the upside or the downside.
In last week’s newsletter I argued that I was somewhat nonplussed about the CPI print this week and that many market participants - as they’re invariably prone to do - are missing the forest for the trees.
Ultimately, any given month of CPI data is inherently volatile and should be treated as just a small reflection in the rearview mirror. If core suddenly slowed, that would be notable and surely move markets (although it’s hard to imagine risk assets could have moved more intraday than they did Thursday anyway!). But I argued last week that this week’s print should be treated with an even bigger grain of salt than normal.
My core thesis was that there are two things worth pinning to the top of your mental model when it comes to inflation:
Inflation coming back inline with target is a matter of when, not if. While it’d be unfortunate for a significant recession to be needed to tame inflation, if one arises, without a gusher of fiscal stimulus to accompany it, then the current composition of inflation makes it clear it’ll quickly fall back down to target.
So what really matters - in particular, to risk assets - is the rate hikes that will be necessary to sufficiently cool the economy to produce a level of inflation inline with target. Therefore, a CPI print matters only insofar as it informs rate hike expectations.
Something that naturally follows from this is that if we have relatively weak inflation in one month - but forward indicators show a sharp rebound in the month to follow - then that won’t change the Fed’s calculus for continued rate hikes or their path forward. (Assuming that we don’t have extremely sharp moves downward).
Further, it’s impossible to imagine a situation in which core inflation that is consistent with the Fed’s mandate, but headline that is well above it, results in a reaction function in which the Fed doesn’t continue to apply monetary pressure.
The Fed may look most closely at PCE and core CPI. However, all inflation measures matter today because the Fed cares about inflation expectations becoming embedded and losing credibility.
So, if you have PCE and core CPI inline with the Fed’s desires, but still have headline running hot, then there will be no pivot toward rate hikes. Headline inflation still very much matters to consumers (just look at how tightly correlated UMICH inflation expectations are to gasoline prices!).
In other words, if headline is still running hot from food and energy costs, that can’t be dismissed as you better believe that will fuel continued wage pressure if there isn’t significant labor market slack in the system.
…Just try telling someone that they shouldn’t demand a 6% pay increase next year because while their gas and food bills may be 20% higher, there’s been deflation in televisions and recreational vehicles.
My argument last week was simple: just look at the Cleveland Fed’s Inflation Nowcast. While it was showing hotter than anticipated inflation for September, even if that didn’t arise the higher energy prices we’ve seen lately (primarily from oil) are already sufficiently baked in to October’s data such that the headline number for October will almost certainly be higher than September’s number.
So, my argument was that even if September’s CPI came in below expectations, could that really be a signal of a pivot coming soon when October’s number will inevitably come in hotter? How does a low or inline number in September, paired with a rise in October, materially change the Fed’s calculus moving forward?
Note: Now it turns out that since September’s CPI came in much hotter than anticipated, it’ll likely be the case that October CPI is inline or even a touch lower than September. But prior to September’s print October’s CPI was looking much stronger.
My general thoughts on September’s print is that while it’s worse than anyone expected, it’s directionally inline with expectations: goods are cooling, services are heating up, rent is creating distortions, and everything is still too high for the Fed to even contemplate talking of a pivot (unless something breaks or a significant economic contraction that feeds into employment gets here quickly).
And, when it’s all said and done, this is largely what rates markets settled on believing after it’s wild gyrations on Thursday and Friday. The market was already nearly fully pricing in 75bps for the November meeting and the market is now pricing a number ever-so-slightly higher than 75bps (i.e., the market is pricing in a very small probability of 100bps in November, which it’s hard to believe would happen).
The biggest change, as you’d expect, is that the December meeting got repriced a bit higher. From pricing in around 50bps to 67bps now (so pricing in a better than 50% shot of a 75bps move in December).

Note: Multiply the #Hikes/Cuts value by 0.25 (one hike) to get the amount of hikes baked in by the next meeting. So the market is implying there will be a 75bps hike in November and an additional 67bps (so either a 50bps or 75bps move) in December.
However, there’s an onslaught of data that will inform the December rate hike still to come. So, even though, as JPM rightly pointed out, it’s hard to paint a positive narrative out of this print, it didn’t have much real world ramifications.
Indeed, even though equities had one of their wildest intraday swings on record during Thursday’s session before then dropping multiple percent on Friday, when it was all said and done SPX closed the week at almost exactly the same level as it did immediately prior to the CPI print.
Likewise, the 10Y treasury is up 12bps from where it was pre-release and roughly inline with where it was on Tuesday of this week.
So, was this all just a rollercoaster ride that landed us exactly where we were before? In short, that’s probably not a bad characterization! In the end, most seem to have come to my conclusion that while this was a bad print, it changed nothing.
But there are certainly a few interesting things of note worth digging into…
Will Goods Disinflation Be Enough…?
Part of the reason why inflation has consistently surprised to the upside over the past year is due to the belief that goods inflation would abate - as supply constraints diminish, etc. - and that inflationary pressures wouldn’t just roll over into services.
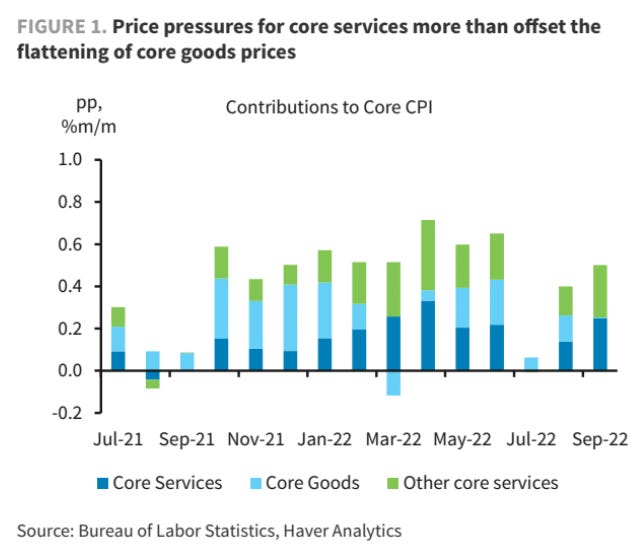
With core services coming in at 0.8% MoM in September - the largest monthly gain in four decades - the latter part of this thesis hasn’t been borne out. But the first part has been given that goods inflation has been trending down for months and was flat over the past month (although still 6.7% YoY) due primarily to used car prices falling.
While the Fed will take any sliver of good news that it can, the rise in core services is most certainly not a welcomed development given that services-inflation is almost invariable more sticky than goods inflation.
As a result, it’s likely not good enough for goods inflation to merely be flat moving forward. Services inflation will take a significant amount of time to roll off, so what we really need for the Fed’s target to come into proximate range within 2023 is a strong deflationary pulse in goods (which was seen in March of 2022, never to return…).
To this end, there are conflicting views coming out of banks. After the CPI print Barclays was the first bank to significantly revise their rates expectations - anticipating 75bs, 75bps, and 50bps over the next three meetings - based on their belief that goods disinflation over the coming months won’t be enough to really make the Fed feel confident that inflationary pressures are trending in the right direction.
Barclays points to three interconnected things to support this: higher than expected GDP growth, higher than expected retail sales numbers (retail sales control group came in above expectations this week), and higher than expected wage growth.
Basically: in other to get retail sales down, you need either lower wage gains or higher unemployment, and to get either of those you need slower GDP growth, which can only assuredly be accomplished by the Fed by using the blunt tool of raising rates.

What shouldn’t be lost here is that what Barclay’s envisions is that because continued inflationary pressures will cause greater front-loading of rate hikes, the damage done through 2023 will be quicker and sharper than in prior forecasts.
So, despite them now having a 75/75/50 rate hike view over the next three meetings, as opposed to a 75/50/25 view, they see inflation getting back in range of target by the end of next year and have projected three 25bps cuts over the final three meetings of 2023!
In other words: a hard-landing is looking more and more inevitable to Barclays.
Will Falling Rents and Used Vehicles Solve All…?
While the word “transitory” has been banished from the vocabulary of all sell-side analysts, a number of research reports have come out over the past few days making the argument that when rent is stripped out of inflation, it’s well on track to reach the Fed’s target by late next year.
While this has a bit of the tinge of the argument “if you strip out all the things going up a lot, inflation is actually low” it is true that inflation metrics are not only per se backwards looking, some components of inflation are heavily backwards looking.
Let’s take a look at a research report from MS in the wake of the inflation print on Thursday…

As you can see, core is still being driven primarily by shelter (rent and owners’ equivalent rent) while we’ve had a nice slowing in nearly all other forms of inflation with exception of medical services (which most believe will materially slow in the coming months due partly to some technical factors we’ll skip over).

Given that shelter inflation operates on a 9-12 month lag, high frequency indicators (the same that predicted this excessive inflation in shelter last year) can be used to try to model out the peak in shelter and the disinflationary pulse that could eventuate.
However, many commentators - in particular, in the financial press - have made this sound rather formulaic. As if since shelter operates on a perfectly defined lag, and you can just project forward what shelter inflation will be with ease.
But as MS said in their post-CPI note: “Notably, the recent re-acceleration in rents and OER is quite a bit stronger than our expanded suite of models would have predicted”. In other words, it’s not quite so easy to judge how high frequency indicators flow through to future rents.
Further, insofar as wage gains remains relatively robust, these tend to feed through to higher rents as long as the local vacancy rate remains very low (i.e., there’s a tight supply of housing — and given that raising rates has an almost immediate impact of multi-unit builders, what one has to hope is that enough building is in the pipeline to boost up the vacancy rate in the near-term, as there will likely to be a sharp slowdown in building this year and next).

Someone a touch cynical can look at all of this and say, “GS, MS, Barclays, etc. have all consistently downplayed inflation and now we’re once again getting rehashed transitory arguments, just without invoking the word.”
I’d argue this isn’t overly fair. The reality is that the biggest contributors to the inflation we’re seeing today - vehicles in core goods, shelter in core services - are trending down sharply by any measure. While one can quibble about the velocity, one can’t credibly quibble about the directionality.

…And here’s a few good charts from BofA…

This is not to say that the Fed has the green light to pause early or take more modest steps on policy tightening. It is very much my view - as I’ve written about before - that without significant labor market slack and wage gain declines, inflation will level off at a much more modest, but still above target, rate.
So the Fed has more work to do. However, it’s just as wrong to ignore the high frequency measures today than it was to ignore them nine to twelve months ago when they were flashing red lights warning of the inflation that was to come.
Countercyclical Fiscal Policy Tensions…
Across the developed world fiscal policy decision makers and monetary policy decision makers have largely been working at cross purposes this year. This finally came to a head in the UK this week - as we’ll get into later on - where the BoE forced the hand of the government to scale back their loose fiscal policy in an unimaginably embarrassing way.
But directionally all developed countries are in a similar position to the UK: feeling pressure to increase nominal spending to support those impacted by inflation, which then stokes future inflation by increasing disposable personal income and making the role of the central bank that much more difficult.
Something that has gone largely under-the-radar, but that JPM helpfully added to a note this week, is the following:
Another consequence of this year’s jump in inflation is the largest Social Security cost of living adjustment in the US since 1981. About 65 million retirees will see benefits increase by 8.7% next year, which should lift 1Q23 real disposable personal income by nearly 2.5%-pts.
When folks like Larry Summers - who was a proponent, rightly in my view, of enhanced fiscal spending in the wake of the financial crisis - argue that inflation will stabilize well above target, this is partly what he’s worried about.
With wage growth still near the tops of this cycle and automatic adjustments being made to social support programs like Social Security, the necessary declines in real personal income haven’t reached even close to the levels necessary to create the demand destruction that can push through a real deflationary pulse in core goods.
Further, it remains to be seen how fiscal policy makers will respond if and when real disposable personal income do decline: is their automatic reflex, regardless of what economists tell them, simply to send out more cheques and further feed the fire?
Summary…
So, what is there really to gleam from this week’s CPI print?
Last week I made the argument that if the print were roughly inline with expectations, then it should be looked through (given that a hotter print on a core and headline basis in October is likely).
While September’s print did surprise to the upside, I maintain that it doesn’t materially change the Fed’s forward path, it just solidifies that a 75bps hike is all but certain in November (which markets were already fully pricing in anyway).
While markets have repriced December higher (to a more-or-less 50/50 shot between 50/75bps) that strikes me as not being overly illustrative — there’s still a lot of data to come between now and the December meeting that will matter far more than the data we just got.
But the themes discussed above are the themes that will need to be carefully watched over the next few prints as we march steadily further towards the Fed’s terminal rate.