


Cooling CPI and Raucous Rallies...
Explaining the record-setting risk-on rally, thinking through the Fed's new reaction function, and why Goldman is now floating the idea of raising the inflation target...

Welcome back to Market Making, your weekly dose of sell-side research and insight.
⏱️ Estimated Read Time: ~36min
✍️ Word Count: ~7,700
📚 This week’s Reading List has been updated
Part 1: Slowing Surprise
At the end of last week’s newsletter, when discussing the major economic data of the week ahead, I briefly touched on the fact that banks were all over the place with their CPI estimates. Primarily because they were struggling to model the deflationary impulse stemming from goods, an uptick in energy prices, and some oddities surrounding health insurance inflation.
The natural consequence of banks being all over the place is that market participants were as well, which meant that there was no real consensus and, well, you can read what I wrote last week below…
This has led to a pretty wide dispersion in the CPI estimates relative to normal, which will almost assuredly provide some nice volatility through Thursday morning…
It turns out we definitely got some nice volatility. In fact, as has been the case quite a few times over the past month, the level of volatility verged on the unprecedented.
Note: I’m using the layman’s definition of volatility here, as actual implied volatility has pretty consistently creaked lower in recent weeks.
Anyway, we’ll get into all the gory details of Thursday’s inflation print in a moment. But here are the headline numbers along with Goldman’s pre-print estimates (since they’ve consistently been on the more dovish side of the inflation equation).
Actual CPI (MoM) +0.44% for October vs. GS +0.49%, median forecast +0.6%, prior +0.39%
Actual core CPI (MoM) +0.27% for October vs. GS +0.44%, median forecast +0.5%, prior +0.58%
Actual CPI (YoY) +7.75% for October vs. GS +7.80%, median forecast +7.9%, prior +8.20%
Actual core CPI (YoY) +6.28% for October vs. GS +6.46%, median forecast +6.5%, prior +6.63%
The CPI print was equal parts stunning and surreal — showing a level of slowing, no matter how you parse the data, that blew away everyone’s expectations. There were no sell-side analyst victory laps to be had: even if they had a forecast well below consensus, they still were nowhere near predicting just how light this print was.
As the dust settled on Thursday, equity markets finished with their strongest rally since the depths of the pandemic, yields got beat down across the curve, the dollar fell the most in over a decade, and credit market spreads tightened.

In case you had any doubt about just how much of a risk-on rally was sparked on Thursday, take a look at what equity baskets performed best — before you ask, yes there really was a 15% gain, in just one day, for Goldman’s “non-profitable tech” basket…

Note: To put into context, just a little bit further, how outrageous the move in the non-profitable tech basket (GSXUNPTC, if you have a terminal) really was: a one standard deviation move for this basket is around 4.15%. So, even in a year of absurd volatility, Thursday’s move stands out as an extreme outlier. In fact, it was by far the biggest single-day move this basket has ever recorded — and it isn’t particularly close.
Now if you’ve been reading past editions of the newsletter, you know something I’ve focused on heavily is the easing or tightening of financial conditions (i.e., when talking about the incredible week of easing that occurred after the Fed’s last blackout period, or the smooth maneuvering of Powell last week to keep financial conditions tight while still communicating a slowing in the pace of rate hikes).
So it won’t be a surprise to you that I was heavily focused on just how much financial conditions would ease on Thursday as all assets moved in a heavily risk-on direction. And the results were stunning: there have only been two days where financial conditions have eased more this century…

Prior to the last Fed meeting, Goldman posed the question of whether Chair Powell was “fine” with how much financial conditions had loosened over the prior week, because, as you’ll remember, that was a level of easing that was nearly record-breaking for any single weeklong period.
This was (obviously) a rhetorical question, as the answer was (obviously) that he wasn’t fine with it, and that was reflected in the incredibly hawkish rhetoric we saw at his press conference just last week.
However, the question we all need to be thinking about moving forward is: if this inflation print isn’t an anomaly, but reflective of inflation actually beginning its slow march down, then is Powell going to be “fine” with financial conditions beginning to heavily loosen up (thereby effectively unwinding part of the tightening that’s come from past rate hikes) and having risk assets rally so heavily?
In other words, even in the midst of a continuing tightening cycle, albeit one that is on its last legs, is it acceptable for a massive easing in financial conditions to occur so long as inflation continues to drift down, gradually, toward target?
I’ll save these questions, along with what happened in the rates and equities market, for the next parts of the newsletter. As before we get ahead of ourselves, we should talk a bit about the inflation print we got and why so many were caught by surprise.
Good Anyway You Slice It…
While frequently you can make a contrarian argument for why “good” data isn’t quite as good as it first appears, doing so with the CPI print we got on Thursday would be pretty pedantic.
It was simply a good report all the way around, no matter how you slice it, and the only question now is whether we will get another one that carries the trend forward next month (the Cleveland Fed’s Inflation Nowcast, which had been quite accurate, but severely overestimated last month’s inflation, is suggesting a sharp rebound in inflation for November: 0.59% for headline, 0.51% for core).
While typically surprising inflation prints will be driven by just one element (i.e., an element of core goods softening more than expected) with October’s print virtually everything was softer than most were expecting or at least showed positive signs.
Sticker Shelter Inflation, For Now…
For inflation to return to anything approximating target, there needs to be a significant slowdown in shelter inflation. In October’s print we got a mixed bag when it comes to shelter inflation that, upon closer inspection, does shows some promise.
The bad news is that shelter inflation, overall, stayed stagnant relative to the month prior at 0.75% MoM — tied for the fastest pace since 1990. The good news is that, below the surface, we see that what kept it high in October was likely a bit of an anomaly.
For whatever reason, lodging away from home reached 4.85% MoM — a number that was the fourth highest on record and that clearly can’t persist (the only readings that were higher MoM were from back when the economy largely re-opened in 2021).
What’s worth paying attention to more is the all important Owner’s Equivalent Rent (OER) that rose by 0.62% MoM (still high!) but which was down by 19bps from the month prior — representing the largest monthly slowdown in over two decades.
While it’s never ideal to have overall shelter inflation at two-decade highs, it appears that the largest component is decelerating quicker than anticipated and that the only reason why shelter inflation remained so high in October was due to an idiosyncratic situation that (obviously) can’t persist at such elevated levels.
As we talked about a number of weeks ago, an issue bedeviling forecasters is trying to pair real-time indicators (showing slowing new lease growth) with the possibility for pre-existing lease growth to pick up the slack. Indeed, Powell at his press conference last week explicitly mentioned this and why you can’t just rely on real-time indicators…
So this is an interesting subject. So I start by saying I guess that the measure that's in the CPI and the PCE, it captures rents for all tenants, not just the new, not just new leases.
So but what you're, the implication is that there are still as people, as non-new leases rollover and expire, right? You still, they're still in the pipeline, there's still some significant rate increases coming. Okay?
While there’s nothing in this print that can help modeling out shelter inflation, it’s at least illustrating that the most important component is pointing in the right direction (as you’d expect after looking at the sharp reversal in real-time indicators).

Health Insurance Deflation, a Helpful Mirage…
While health insurance is a small component of CPI, it went from providing a strong inflationary pulse last month to providing a strong deflationary pulse this month by coming in at negative 4.0% MoM.
This was something everyone knew would happen (although the magnitude was larger than most expected) because of the unique way that health insurance inflation is calculated. Here’s how Goldman explains it:
The reason is that the CPI incorporates source data on health insurer profitability once per year and feeds them through for the next twelve months. Last year, roughly stable premiums coupled with reduced health care use amidst Covid fears caused profit margins to rise, leading toa year of very strong health insurance inflation (+2.1% in September; +28.2% year-on-year).
Now, the rebound in health care use has caused profit margins to fall, which should lead to a year of very negative health insurance inflation (-3% in October; -28% next twelve months).
So for the next year, there will be a nice deflationary pulse from healthcare...

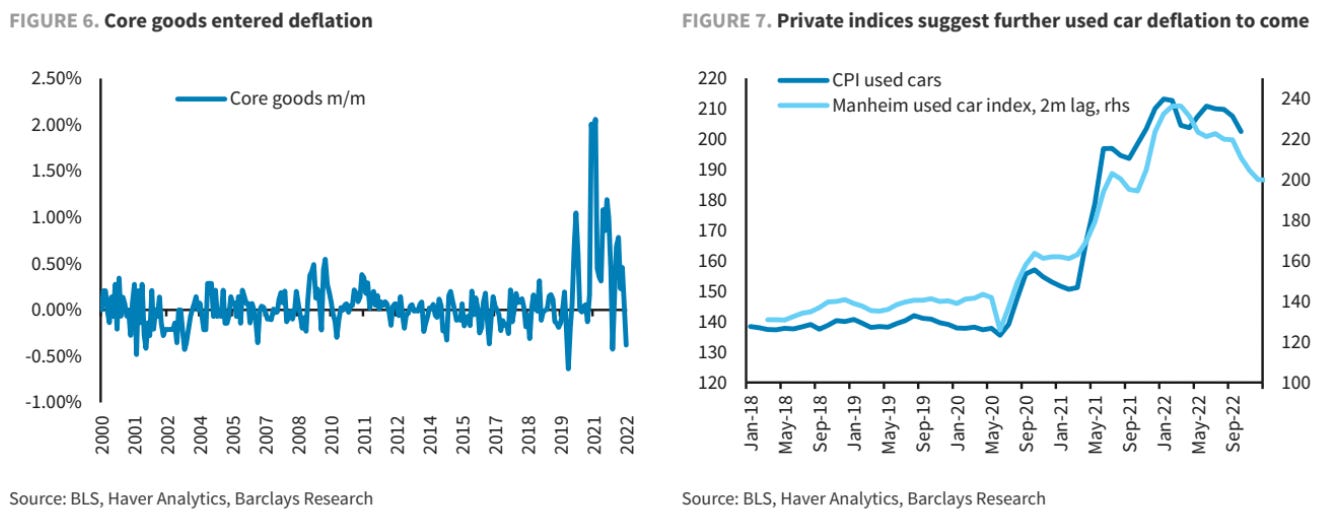
Core Good Providing a Deflationary Impulse…
After last month’s CPI print, I stressed the need for deflationary impulses to arise given that it was unreasonable to expect all components of inflation to uniformly return back to around target in just a year or two.
Fortunately, this month we did have a relatively broad-based deflationary reading coming out of core goods — particularly fortunate given that services inflation has remained extremely elevated and relatively sticky thus far.
Core goods fell by 0.31% MoM, which was a downside surprise to nearly everyone’s estimates. Leading the way, as analysts did expect, were used cars with a 2.4% drop MoM (there’s likely much more to come from this area based on real-time indicators).
The real surprise came from home furnishing — perhaps being impacted by the real wage declines that people are now feeling, or perhaps being impacted by how much housing sales have slumped in recent months. Whatever the reason may be, it fell 0.1% MoM marking the first decline since February of 2021 (it’s still up 8.8% YoY).
There Were Some Upside Surprises…
While core measures have shown promise, there were upside surprises to both food and energy relative to analyst expectations — neither being welcome developments to the average consumer.
Food inflation came in at 0.60% MoM, the slowest since August of 2021 but still above expectations. However, this was primarily driven by food away from home, at 0.94% MoM, which is just shy of a four decade high — so a level that is unlikely to be repeatable into future months.
Further, energy surprised to the upside across the board as well which is likely to persist into this month. While the rise was more modest than we saw earlier this year - with gas rising 4.0% MoM, for example - we saw heating oil rise 10.5% MoM.
While heating oil isn’t a significant enough component of the basket to really move energy inflation, because heating oil is predominately used in just New England, it’s a reminder that the impacts of inflation are felt much differently across the country based on somewhat random factors (i.e., primary heating source variability).
The Implications Moving Forward…
To look at the reaction from markets, you’d be forgiven for thinking that there was something embedded within this inflation print that fundamentally altered how market participates are going to model inflation moving forward — something causing market participants to recalibrate their projections down significantly.
However, as you can tell from the overview above, the softness in October’s report was relatively broad-based. It’s not that there was some fundamental change, it’s just that everything largely came in softer than expected across the board thereby causing a print that was quite a bit below expectations.
As a consequence of this, there aren’t any sell-side analysts furiously rejiggering their inflation models now. While most have very modestly lowered their inflation forecast for November, most are still forecasting an inflation rate that will tick up from the actual print we just received.
Further, to my knowledge, no bank has changed their house view regarding the rate path from here despite how much the yield curve got beat down on Thursday: the consensus is still for 50bps in December and 25bps in both February and March.
Note: Although there are a few who have been calling for a pause after February, these were calls made prior to the print.
Indeed, if you were just given the sell-side research on the inflation print, without knowing how the market reacted, you would have predicted that a strong risk-on rally occurred (as it was an unmitigatedly good print!). But you wouldn’t have expected the rally to be too strong since it’s difficult to argue this singular print changes anything from a rates perspective too much moving forward.
If inflation continues to print below expectations - showing a sharp deceleration that matched its sharp acceleration earlier in the year - then you can make two arguments: there’s less risk of a higher terminal rate and there’s less need for rates to stay higher for longer.
But did just one month of favorable data warrant the third largest day of easing in financial conditions this century, which continued unabated into Friday even while the bond market was closed? Or, as Goldman put it, was the market simply stunned into action after months and months of relatively bad news on the inflation front?
Here’s a great chart pointed out by Bob Elliot, formerly of Bridgewater, that helps put things in a bit of context. It appears many forget that we had a false dawn in July with a 3.8% annualized CPI print, much lower than the prints that came before and the prints that came after.

When inflation readings are at such historically elevated levels, there’s bound to be month-to-month volatility in subcategories that sway the prints — a data point doesn’t make a data trend, even if it is objectively a great data point…
Part 2: Shorts Squeeze as Financial Conditions Ease
Let’s begin with a bit of framing, courtesy of a note dropped by Goldman on Thursday night in the wake of the CPI print…
Clearly few expected a CPI miss of this magnitude. One month ago we were writing about how poor the tone had been set by inflationary pressures and now, the world is different — or at least the market will want to interpret it that way.
The magnitude of the rally can also be explained by the fact that the market had been seeking out evidence for a turn for a number of weeks. Perhaps it is that active search for a silver lining by the market that is more informative than any specific data point here.
For the past month I’ve been writing about markets champing at the bit — just waiting, desperately, for permission to ratchet higher. Indeed, we saw this same script play out after the last CPI print, even though it was disappointing by any measure, and then after the more dovish rhetoric prior to the last blackout period, before Chair Powell quashed markets with his hawkish rhetoric last week at his press conference.
After multiple false dawns, markets have finally, mercifully, been given a reason to rally. The price-action of Thursday and Friday seems to indicate that the consensus thinking is that if inflation is precipitously falling back to target then there’s no reason for the Fed to continue tightening the financial condition screws or otherwise derail the rally from continuing.
However, the obvious retort here is: how far does inflation need to fall, and how quickly, before the Fed is actually fine acquiescing to the market loosening financial conditions for itself? Is the market, once again, getting ahead of itself here?
Let’s first deal with what’s been going on in equities, then we’ll move onto rates and the dollar (these latter two had their own outsized moves, with the dollar falling the most in over a decade on Thursday…).